Best IQ Option Strategy Tips Tricks - Binoption
Home» Binary Options Strategy » Best IQ Option Strategy- IQ Option Tips For Winning Trades

Best IQ Option Strategy- IQ Option Tips For Winning Trades

IQ Option is a broker that offers binary and digital options along with CFDs on forex, crypto, stocks, commodities, indices, and ETF’s.

Owned by Sky Ladder LLC, it is based in Antigua and Barbuda. Due to their award-winning feature, IQ Option has over 25 million registered users

We will suggest to read this IQ Option Review if you don’t have clear picture on this online trading broker.

With so many traders using this platform, we felt the need to come up with a IQ Option strategy guide that traders can follow to earn profits and avoid losses.

Our IQ Option strategy guide will be divided into four sections: strategies, tips and tricks, tools, and indicators.

In the strategies section, we list certain strategies that you can implement in your trading to get the best results.

In our tips and tricks section, we list our selection of best trading tips to take your trading game to the next level.

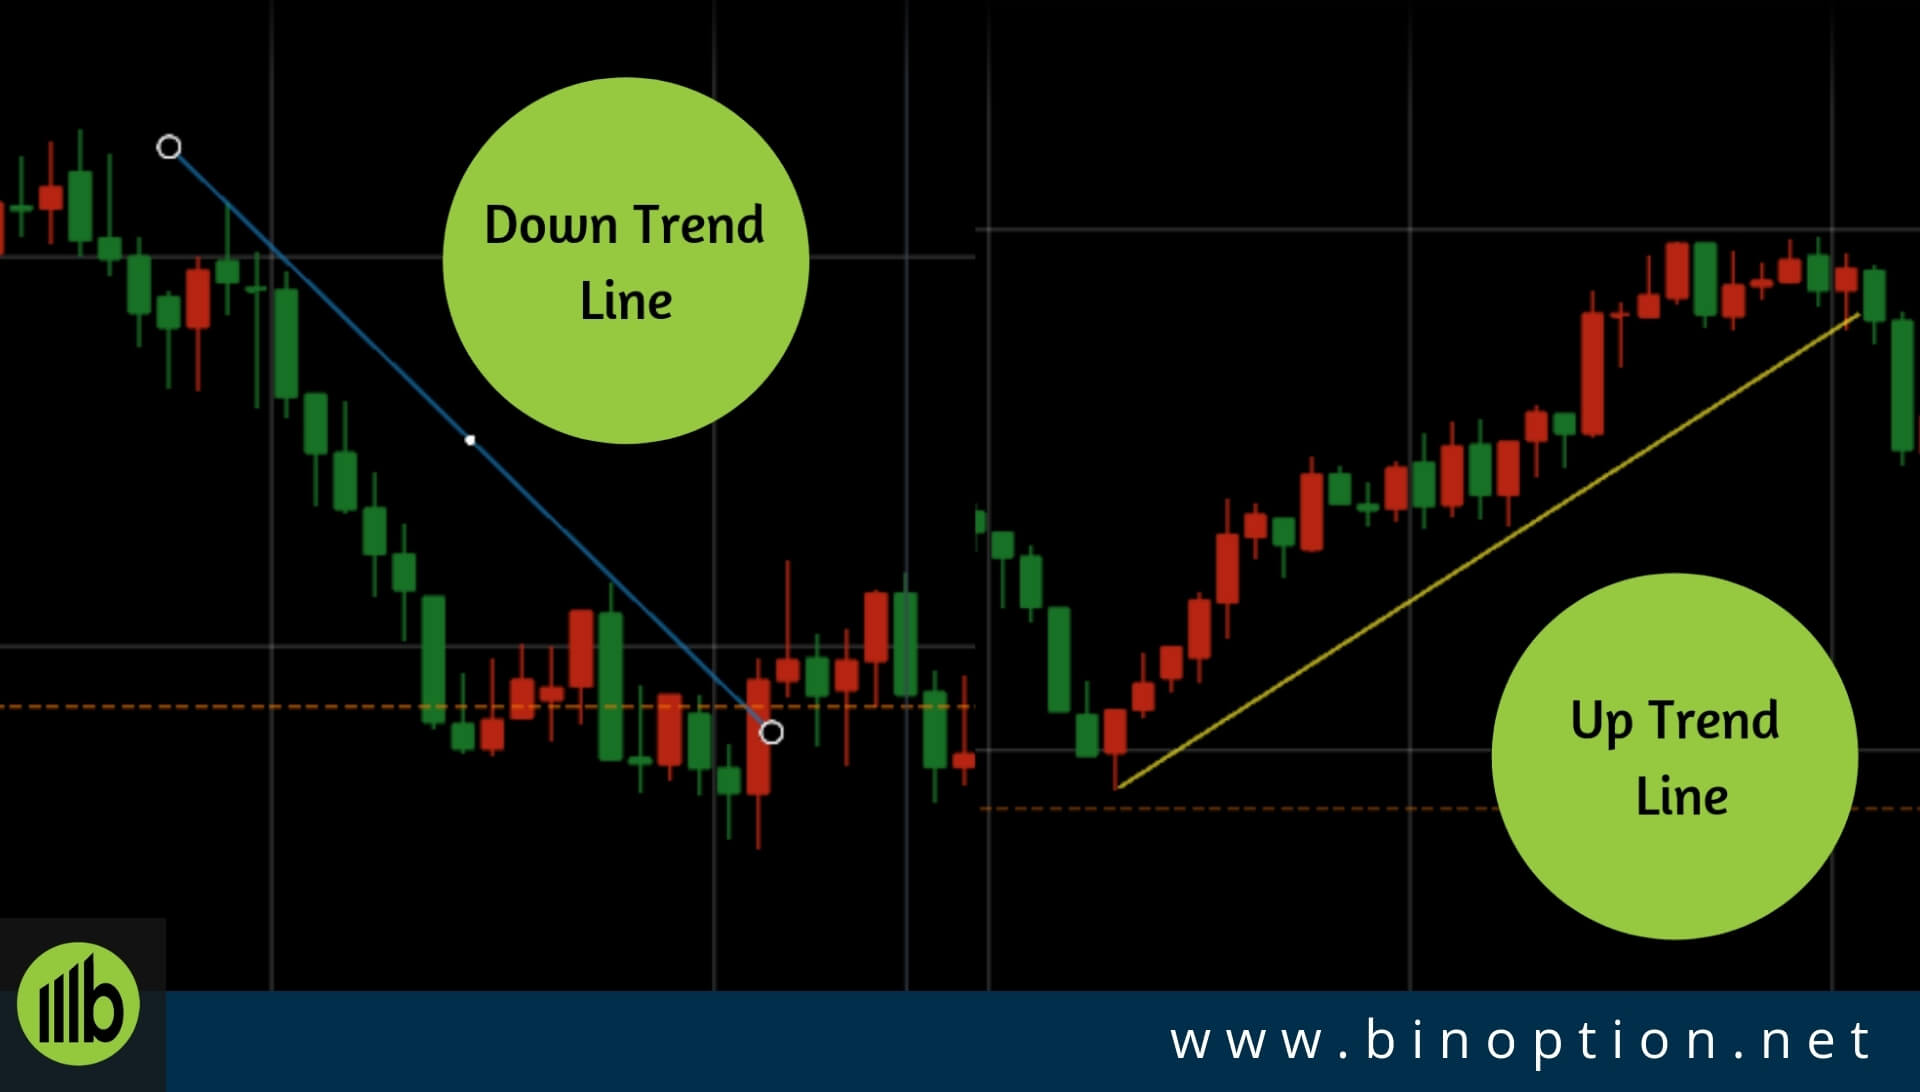
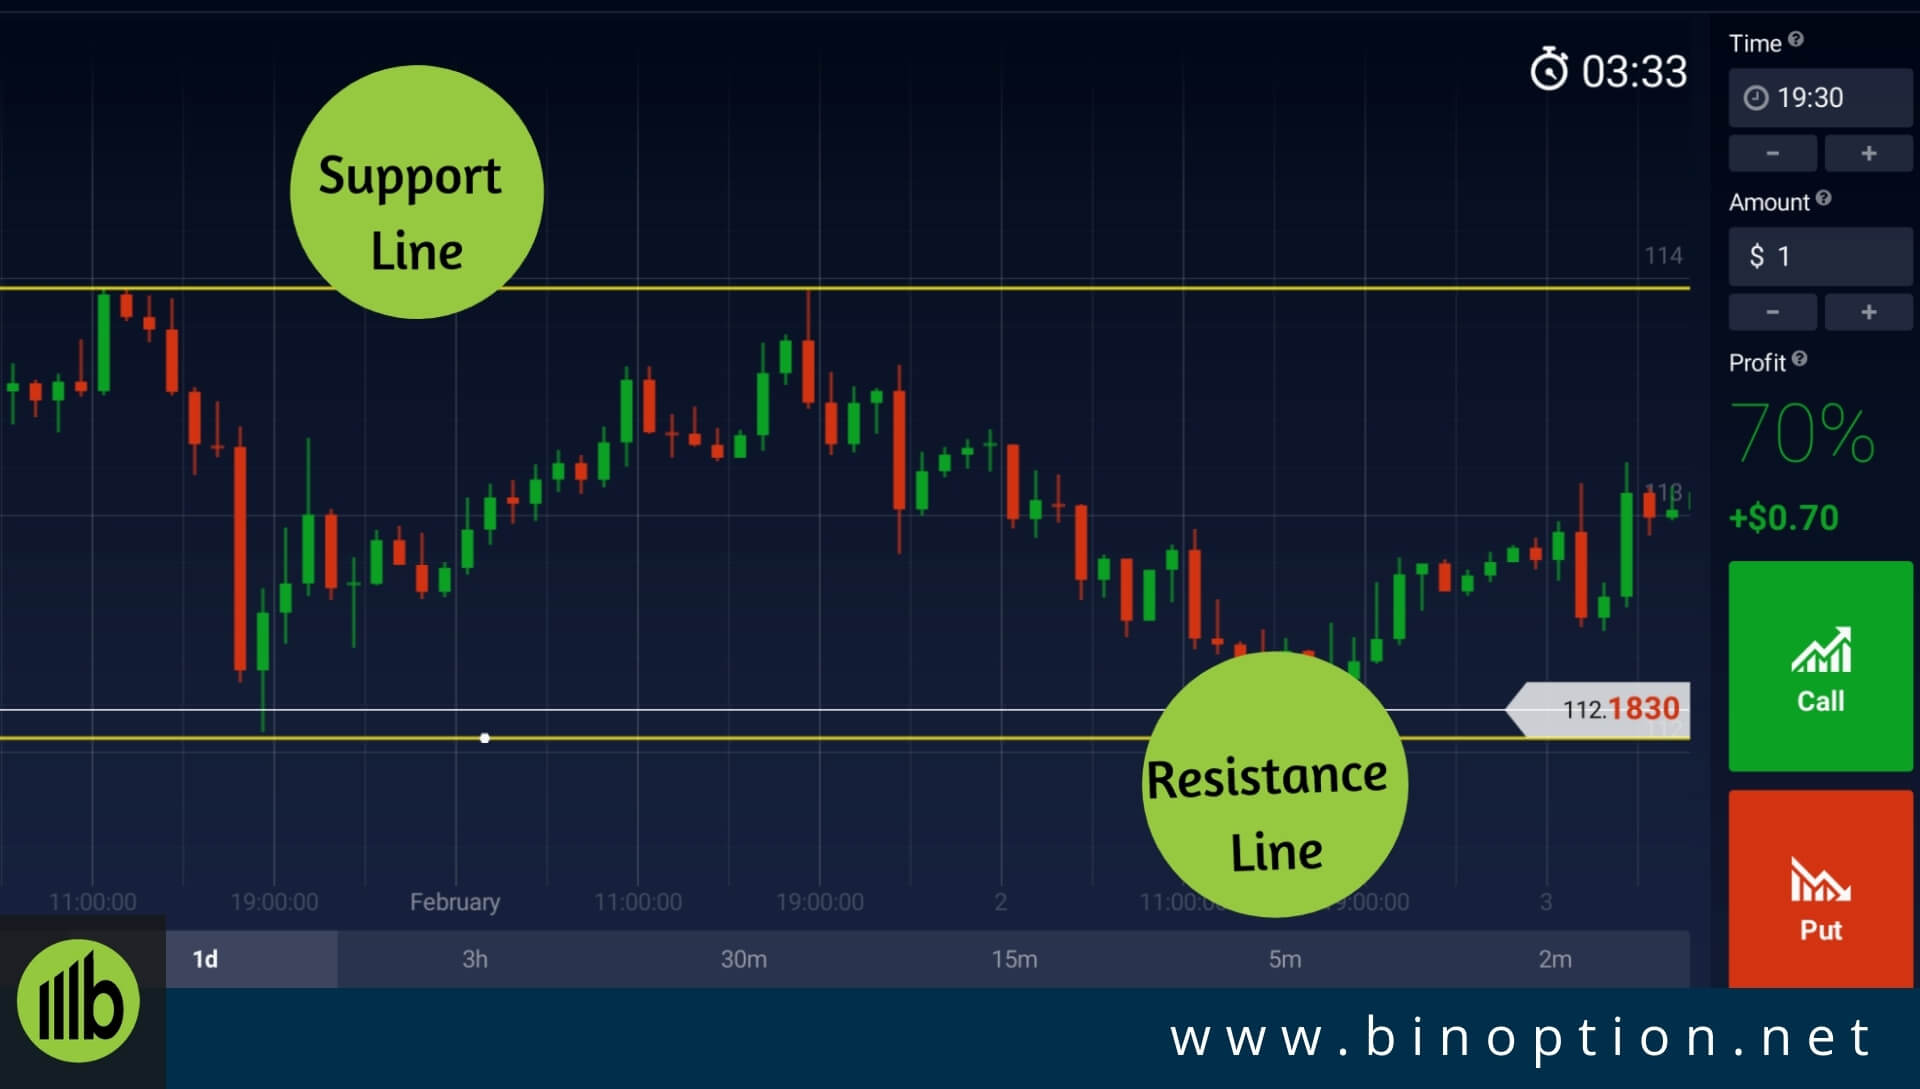
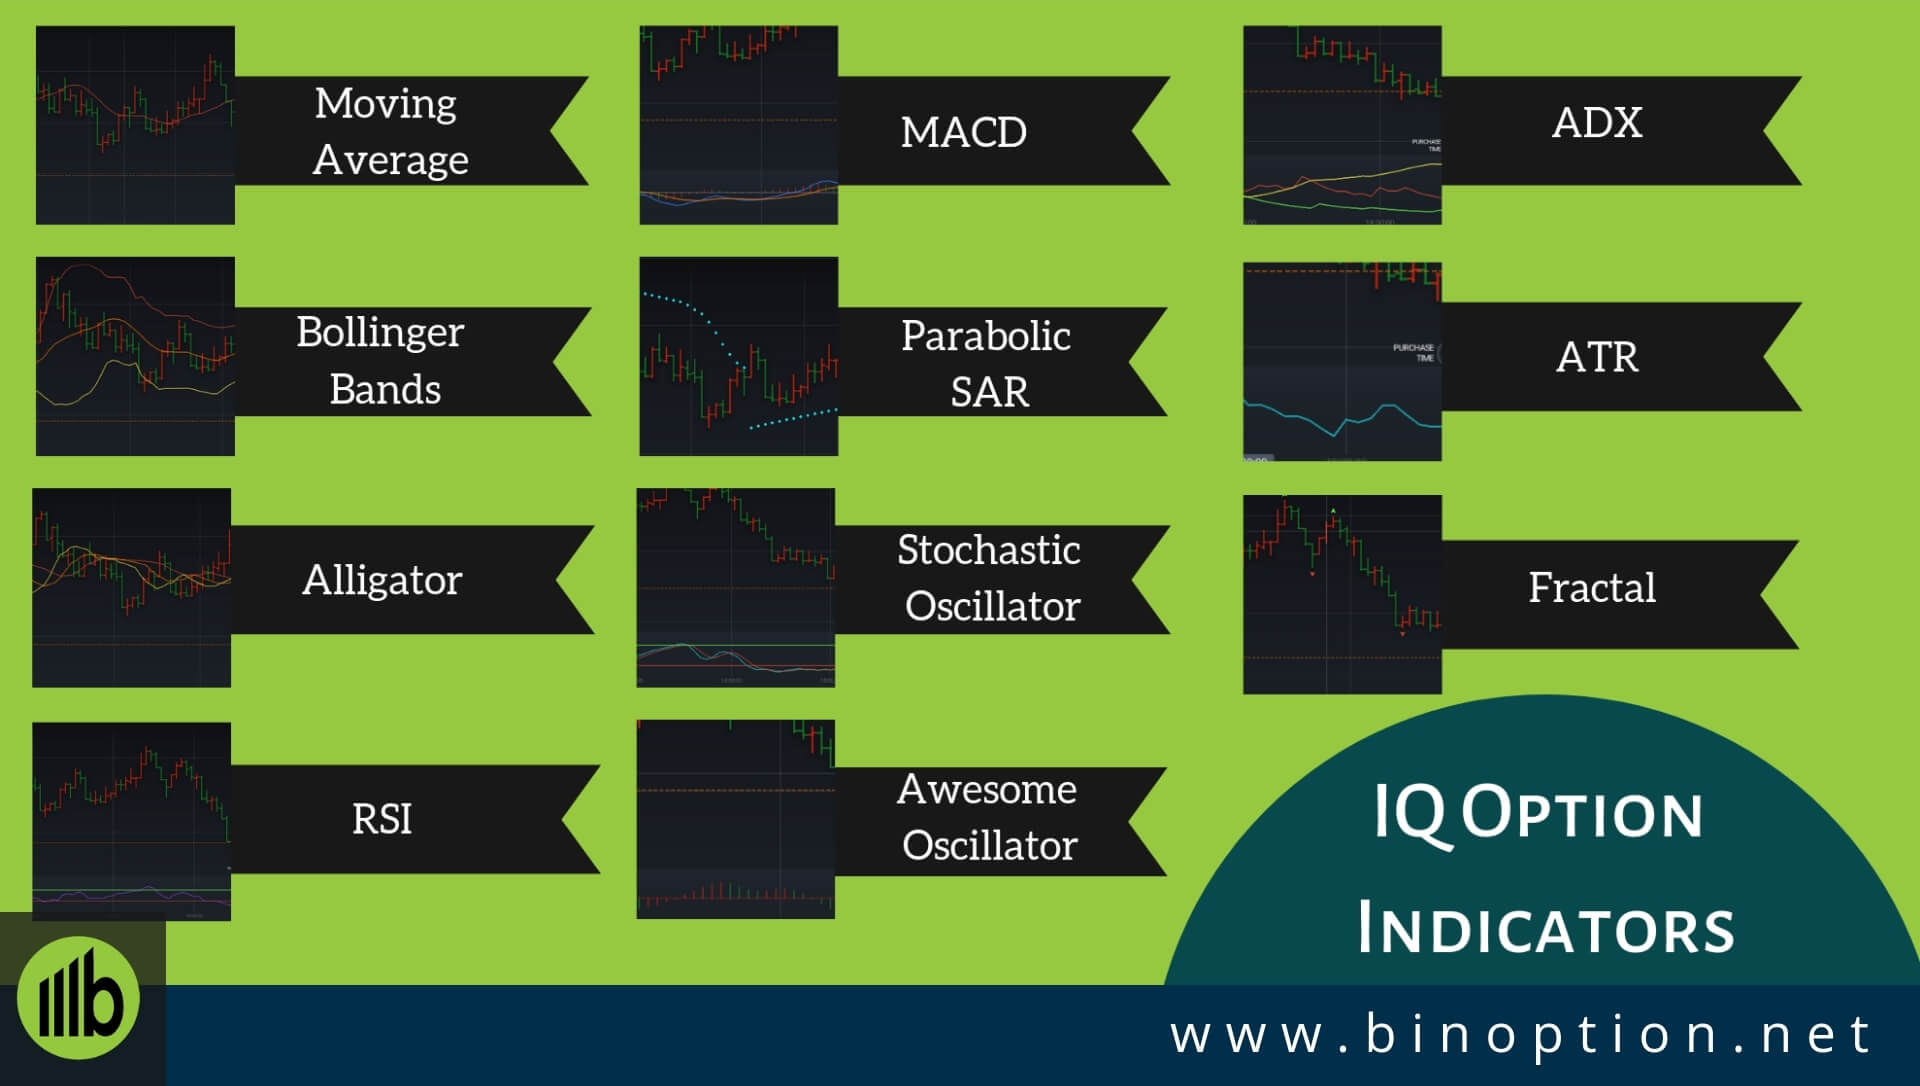
Under tools and indicators, we have listed the various graphical tools and indicators that can be used for technical analysis and form strategies.

We will start with best strategies for IQ Option.

Best IQ Option Strategy – Price Action

Best-IQ-Option-Strategy-Price-Action-Binoption

Candlestick and bar charts are our favorite to use in IQ Option’s trading platform.

They are versatile and provide a lot of analysis for price prediction.

Here we will list out most used price action strategies for candlestick and bar patterns.

 Price Action Strategy for Candlestick Pattern

The two patterns that we use the most in a candlestick chart are the morning star and the three black crows pattern.

Morning Star Pattern:

The morning star is a 3-bar pattern. The star refers to the candlestick with a small body that does not overlap with the preceding candle body. A star always involves a gap. A morning star consists of the following:

  • Long bearish candlestick
  • A star below the candle
  • A bullish candlestick that closes within the body of the first candlestick.

Three Black Crows Pattern

Three black crows is a candlestick pattern that consists of three consecutive candlesticks. Each of these candlesticks should open within the previous candle body and close near its low.

As each bar opens within the body of the previous candlestick, it suggests bullishness. As each bar closes lower, the bearishness becomes apparent.

This pattern is effective for trading reversals. You should sell below the three black crows after a market rise.

  Price Action Strategy for Bar Pattern

Best IQ Option Strategy Price Action Strategy For Bar Pattern - Binoption

For bar patterns, we will use the reversal bar pattern and the exhaustion bar.

Reversal Bar Pattern:

The bullish reversal bar pattern goes below the low of the previous bar before closing higher. This means the market found support below the low of the last bar. And it managed to push the bar to close higher than the previous bar. This represents a sign of bullish reversal. It would help if you bought above the bullish reversal bar in an uptrend.

The bearish reversal bar pattern goes above the high of the last bar before closing lower. The market met resistance above the high of the previous bar. This resistance is strong enough to bring the bar to close lower. It would be best if you sold below the bearish reversal bar in a downtrend.

Exhaustion Bar Pattern:

An exhaustion bar signals the exhaustion of a trend in the current direction.

The bullish exhaustion bar opens with a gap down. Then it closes up firmly with high volume without fulfilling the gap. It would help if you bought above the bullish exhaustion bar.

On the other hand, a bearish exhaustion bar opens with a gap up. Then it moves down powerfully with high volume without fulfilling the gap. It would be best if you sold below the bearish exhaustion bar.

RISK WARNING: YOUR CAPITAL MIGHT BE AT RISK

More Useful Patterns For IQ Option Strategy

In IQ Option platform you can use more patterns for successful trading strategy. They are –

Breaking Minimum And Maximum

This graphical pattern includes exponential moving average with a period of 13. It can be selected with the help of technical analysis tools.

Determining the maximum and minimum of the moving average will determine the access points of that market.

Using lines available in the graphical tools section of the platform, you need to create maximum and minimum horizontal lines for this indicator.

The right moment to entering the market, i.e. to buy a call option is when the moving average breaks the maximum line.

On the other hand, the right moment to buy the put option when the moving average breaks the minimum line.

 Rainbow Pattern

The Rainbow pattern involves the usage of three exponential moving averages with different periods.

The first EMA: Period- 6, Color- Blue.
The second EMA: Period- 14, Color- Yellow.
The third EMA: Period- 36, Color- Red.

Check if the blue line is above the other two lines, the yellow line is under the blue line, and the red line is below the other two lines.

When this happens and subsequently, the blue and yellow lines intersect, you can consider this a point of entry and purchase a put option.

When the blue line is below the other two lines, yellow in the middle, and the red line above the other two lines, and subsequently, the blue and the yellow lines intersect, you can consider this a point of entry and purchase a call option.

 Rebound From The Line

The line rebounding pattern is used when the price cannot break the support and resistance levels.

When the price reaches the resistance level, and the first candlestick closes below the resistance level, the uptrend has stopped and the price will continue to drop.

On the contrary, when the price reaches the support level, and the first candlestick closes above the support line, the downtrend has stopped and the price will continue to rise.

The resistance and support line rebound is revelant for neutral, upward, and downward trend.

 Breaking The Trend Line

Line breaking pattern is used when the price level breaks the support and resistance line.

When a candlestick closes above the resistance level, the trend is considered as an upward one and the price is expected to rise.

When a candlestick closes below the support level, the trend can be considered as downward and the price is expected to fall.

The line breaking pattern is relevant for neutral trend, uptrend, and downtrend.

 Piercing Pattern

The piercing line candlestick pattern is used by traders to identify a possible reversal of the downtrend.

After a series of several consecutive downtrends, an ascending candlestick closes above the body of the previous descending candlestick.

If two more ascending candlesticks follow, the third candlestick can be considered an opening point to that market and a reversal from the downtrend to uptrend.

Recommended IQ Option Strategy

So far, we have listed our preferred trading strategies for IQ Option. In this section, we have compiled the various strategies recommended by IQ Option.

IQ Option Strategy – Bolly Band Bounce

This IQ Option strategy is based around the Bollinger Band indicator. It is used when the price fluctuates within a certain price range.

The Bollinger Bands serve as dynamic support and resistance levels from which the price is expected to bounce off.

We can consider where the price action and the outer band intersect as both entry and exit points.

Using stop-loss and take profits is recommended when using this strategy for IQ Option. In order to implement this strategy, choose Bollinger Bands from the list of indicators.

The next step would be to determine that the price isn’t trending and instead in a range.

When the price bounces off one of the outer-bands and moves in the opposite direction and touches the other outer band, the price is considered to be ranging.

All you have to do now is waiting for the price to intersect with any of the two outer bands. When this happens, open a long position depending on the direction of the cost.

You can use additional tools such as support and resistance levels, Fibonacci retracement, and candlestick patterns.

IQ Option Strategy- The Bladerunner

The Bladerunner strategy is intended for everyone on any asset and any time period.

This makes it an interesting strategy to use. The name Bladerunner is used because it cuts the price action into two, like a blade.

The indicator that is recommended for this IQ Option strategy is the 20-period EMA (Exponential Moving Average) along with support and resistance levels.

When the price is above the EMA, the price can be expected to be on an uptrend.

When the price is below the EMA and continues to stay below it, the price can be expected to be on a downtrend.

If the price moves through the EMA and the candle closes on the other side of the curve, then a trend reversal can be expected.

Apply the 20-period exponential range to the price chart.

When the price action leaves the range, then open a long position in a bullish trend or short when the trend is bearish.

RISK WARNING: YOUR CAPITAL MIGHT BE AT RISK

What IQ Option Strategy Can You Use With Awesome Oscillator?

The Awesome Oscillator is a histogram-based indicator used to measure market momentum. This special indicator uses to find reversal points. So what strategy can we adopt with this indicator?

Firstly, select the Awesome Oscillator from the list of indicators in the IQ Option’s trading platform.

3 use cases of this indicator will be discussed now:

~ Zero Line Crossover:

When the AO crosses the zero line, the short-term momentum rises faster than the long-term momentum. You can open a long position when this happens. When the AO falls below the zero lines, the short-term momentum falls faster than the long-term momentum. You can go short when this happens.

~ Twin-Peaks:

If there are two consecutive price peaks, they can take the role of either bullish or bearish trends. Twin Peaks can be bullish when both peaks are above the zero line, the second peak is higher than the first one, and the gap between the two peaks stays below the zero line.

~ Saucer:

Traders can use the saucer for trend forecasting. If the AO is above zero and a green line is present after two consecutive red lines, then the saucer is considered being bullish. If the AO is below zero and the red line is current after two straight green bars, then the saucer is deemed to be bearish.

IQ Option Strategy – News Trading

There’s a direct correlation between market news and the effect it has on your trading strategy.

News can constitute economic, financial, and political events. News can be both positive and negative.

Any positive news on an asset will result in a price increase in that asset as more and more people will start buying it.

Similarly, any negative news on an asset will result in a price drop of that asset as more and more people will start selling the underlying asset.

Let us see the impact different types of news have on the market.

Trading on the basis of Political News

Political news affects the economic and financial condition of a country.

Political events can range from elections, revolutions, impeachments, deaths, etc all of which can lead to political unrest.

The recent Brexit referendum which proposed the exit of the United Kingdom from the European Union affected the British economy negatively.

The pound dropped 10% against the dollar.

How should you react to such events? By selling.

These events usually result in the price drop of the asset so you should sell as soon as these political events occur.

 Trading on the basis of Financial News

Financial news comprises of reports published by publicly traded companies.

These reports contain information such as revenue, net income, earnings per share (EPS), and cash flows. Reports can be quarterly, half-yearly or annual.

How do you shape your strategy based on these reports?

Compare the current figures to the forecasts.

If the figures in the reports have exceeded the financial news, the shares of the company increase in value and hence you should buy.

If the opposite happens, then you should sell the shares.

 Trading on the basis of Economic News

Economic news is comprised of economic releases such as reports, surveys, and statistics.

These show various data such as unemployment rate, GDP, industrial production index, interest rates, inflation rate, etc.

Economic news can also constitute announcements made by major financial bodies such as the national banks of countries.

Why should you keep a tab on these reports? For example, an increase in the key interest rates of currency would mean an increase in the price of that currency.

These reports serve as an indicator of when to buy and when to sell.

Utilizing The Market Analysis Feature in IQ Option Strategy

Market Analysis Feature In IQ Option Strategy - Binoption

One thing that sets IQ Option apart from other trading platforms.

The market analysis section which is available on the bottom section of the trading platform.

The market analysis consists of:

 News
 Forex Calendar
 Earnings Calendar
 Crypto Calendar

You can check these for the latest market news on your underlying asset before trading them.

Remember that the price change on assets due to market news happens within minutes.

Make use of this to maximize your trading profits and shape your trading strategy accordingly.

IQ Option Tips and Tricks for trading in IQ Option’s platform

IQ Option’s innovative trading platform is actually quite simple.

Placing a trade and adding risk management is a matter of a few clicks.

There is no complexity to performing trades. However, where you need to be accurate is in your predictions.

This is why you can follow these trading tips to stay ahead of the competition and make profits consistently.

We have compiled a list of trading tips that have been recommended by IQ Option.

Top 5 Forex Winning Tips For IQ Option

IQ Option Winning Strategy For Forex - Binoption

The forex market is very volatile hence you cannot trade blindly and expect to see profits. This is why we present you certain tips and strategies for trading forex successfully in IQ Option.

A winning forex strategy should consist of the following:

 Sticking to the fundamentals:

Fundamental analysis is crucial for any forex trader. It consists of monitoring the market conditions and following the market news. It is the first step a trader should perform when trading forex.


 Use technical tools:

After the fundamental analysis, another important part is technical analysis. To perform technical analysis a trader should use some technical tools such as charts, trend lines, support and resistance lines, and price action.


 Form an effective strategy:

Combine the fundamental and technical analysis and form your strategy accordingly. If a strategy is bringing you consistent results, stick to it. If not, then consider revising your strategy.


 Implement risk management:

Invest a small percentage of your account on single trades, use stop losses and take-profits, and utilize hedging. If required, you can also use advanced stop losses such as trailing stop loss.


 Monitor the trade:

Even after placing the trade you should constantly monitor your trades and keep an eye in case the market moves against your position in the opposite direction rapidly. Close the trade if necessary.

IQ Option Strategy – Hedging in Binary Options

Hedging can be used as a risk-management tool.

It involves buying both the call and put option at the same time.

If you lose the call option, the put option will hedge your loss and vice-versa.

Here, the strike price of the call option will be lower than the put option.

The best situation would be when the actual price would be between the strike price and both the options would be ‘in the money’.

That means you would make from money from both call and put options.

With the advantages hedging present, there is also one drawback to this strategy: you don’t achieve your full profit potential when you hedge.

RISK WARNING: YOUR CAPITAL MIGHT BE AT RISK

5 traits of successful traders

IQ Option Tips And Tricks For Successful Traders - Binoption

Every successful trader must possess the following must-have traits:

 Discipline
 Patience
 Perseverance
 Flexibility
 Modesty

IQ Option Trading Tips 1 – How to trade when the market is flat:

Flat market means when the market moves sideways, i.e. the price is steady.

There is no upward or downward movement of the market.

In this case, your best bet would be to not open any new deals. Instead, you could focus on other aspects of your trading such as:

 Performance Review:

Take a quick look at your trading journal and see what can be improved.

 Sector Analysis:

Perform sector analysis to find out new trading opportunities.

 Technical Research:

Conduct technical research and find out the lacking in your trading strategy. Technical analysis can help you strategize for individual trading assets and time frames.

IQ Option Trading Tips 2 – Three things to do when the market moves against you:

Don’t panic when the market moves against your position.

Have faith in your trading system. When you panic, you tend to commit trading errors which later prove to be costly.

Instead, you can do the following:

 Relax:

Don’t get over-emotional and stress about it. By staying cool-headed you can take better decisions.

 Use stop-losses:

Stop losses will help you control your losses and protect your profits. When the market price breaks a major area of resistance, adjust your stop-loss accordingly.

 Close the deal:

You cannot control the market and therefore when the market moves rapidly against you, don’t hesitate to close the deal.

RISK WARNING: YOUR CAPITAL MIGHT BE AT RISK

Trading Tools For IQ Option Strategy

The trading tools in IQ Option consist of charts, graphical tools, and other lines.

Trading charts display the price movement of an asset over a particular period of time. There are different types of chart that will be discussed below.

Graphical tools consist of drawing tools used for creating technical analysis. The various graphical tools of IQ Option will be discussed down below.

We’ll break down these trading tools of IQ Option according to their purpose served in forming a strategy. Let’s start with the chart types:

IQ Option Charts

Novice traders are guilty of one major mistake when using charts. They use the default line chart.

There is nothing wrong with using a line chart but they are missing out so much information by not using other charts available to them.

We will list and give a short explanation of the different types of chart available in IQ Option.

~ Line Chart:

The line chart is the most basic. It displays the closing price of each period. Other than that, there are no additional details available.

So, it makes them cleaner to view compared to other charts. Line charts can, however, be used for observing long-term trends and picking out specific chart trends.

Line charts are a good start for beginner traders as they’re simple to understand but to understand the price dynamics, they will need to switch to more advanced charts.

~ Candlestick Chart:

As the name suggests, candlestick charts contain candles, where each candle is the range between the opening and closing price of the asset. The lines above and below the candles represent the upper and lower wick, respectively.


Candlesticks are one of the top choices for a trader’s chart preference. They can easily add price action candlestick patterns such as Doji, Piercing Line, Morning Star, Three Black Crows, and many others. These allow further analysis for price prediction. The difference between candles in width represents the relationship between them.

~ Bar Chart:

Bar charts are also referred to as OHLC charts because they display four vital data:

  • O: Opening Price
  • H: Highest Price
  • L: Lowest Price
  • C: Closing Price

These four pieces of data from a bar chart are crucial to understanding the relationship between them.
Bar charts occupy less space than candlestick charts while displaying more information.

The important price action bar patterns are reversal bar, exhaustion bar, Pinocchio bar, two-bar reversal, and others.

~ Heikin-Ashi Chart:

Heikin-Ashi means an average bar in Japanese. This indicator combines the open-close data from the previous data and the open-close data of the current period to create a combo candlestick. Unlike regular candlesticks, bullish or bearish patterns containing one to three candlesticks are not to be found. Heikin-Ashi is used to predict trending periods and reversal points.


The Heikin-Ashi uses a different formula than regular candlesticks for calculation:

  • Open = (Open of previous bar + close of the previous bar) /2 [This is the midpoint of the previous bar].
  • Close = (Open + High + Low + Close) /4 [This is the average price of the bar].
  • High = Max (High, Open, Close) [Highest value of the three].
  • Low = Min (Low, Open, Close) [Lowest value of the three].

How To Use Multi Charts For IQ Option Trading

You can monitor price changes of multiple assets by simultaneously opening several windows. Also, a trader can view the trend of a single asset in different scales and times by opening that same asset multiple times and customizing the parameters.

This feature is extremely useful for traders who use capital management strategy. Professional traders use multi-charts to determine the correlation between interdependent assets.

For example, the price of the USD/NOK pair depends on the price of brent oil.

You can also utilize the parabolic SAR indicator to determine the trend change. If the indicator knobs are below the chart, they will probably ascend.

If not, it is descending.

In a nutshell, multi-charts help you take a more informed decision by providing you with objective information.

Usage Of Graphical Tools For IQ Option Strategy

You can draw various types of lines on the charts for market analysis. There are five types of line that you can draw.

These lines are primarily used for three purposes; trend lines, support lines, and resistance lines.

Trend Lines:

IQ Option Strategy Trading Tools Trend Line - Binoption

A basic assumption when doing technical analysis is that prices trend. And an important element of technical analysis is trend lines.

Trend lines are used to identify and confirm the trends. A trend line is a straight line that connects at least two price points.

These lines are then extended into future time periods where they act as support or resistance lines.

There are two types of trend lines: uptrend lines and downtrend lines.

~ Uptrend Line:

The uptrend line has two or more points that connect, form an upward slope. Moreover, the points are low, and the second low point must be higher than the first low point.

When three such points are connected, it is considered to be a good uptrend line.
The upward trend shown here indicated that the demand is increasing more than the supply, which indicated a price increase. This market is considered bullish, and it remains so as long as the prices stay above the trend line.

Lorem ipsum dolor sit amet, consectetur adipiscing elit. Ut elit tellus, luctus nec ullamcorper mattis, pulvinar dapibus leo.

~ Downtrend Line:

The downtrend line is the exact opposite of an uptrend line. This line has two or more high points where the second-highest point must be lower than the first high point.

When at least three such points are connected, it is considered being a valid downtrend line.


The downtrend line indicates that the supply is increasing at a faster pace than the demand. This market is considered to be bearish, and it remains so as long as the prices stay below the trend line.


Other metrics, such as the angle of the trend line also indicate the movement of the market. A steep trend line means the increase/decrease happens over a short period of time.

Support Lines:

Support is the price level at which the demand is considered to be strong enough to prevent the price from dropping further.

As the price drops towards the support level, the temptation to buy at a lower price increase.

And when the market price reaches the support level, the demand exceeds the supply and thus the price doesn’t drop any further.

When the support level breaks, this means sellers are ready to sell at an even lower price.

In IQ Option, to draw a support line, you need to select the graphical tools option and then select the horizontal line.

IQ Option Strategy Support And Resistance Lines - Binoption

Resistance Lines:

Resistance is the price level at which the supply is considered to be strong enough to prevent the price from increasing further.

The idea here is that as the price level reaches the resistance levels, sellers get the urge to sell while the buyers become less interested to buy.

At one point, the price level will match with the resistance level and at this point, the supply will exceed the demand and prevent the price from rising above the resistance level.

Like support levels, resistance levels break too. This means that the buyers are willing to buy at a higher price. A new resistance level is established at this point.

In IQ Option, to draw a resistance line, you need to select the graphical tools option and then select the horizontal line.

You can draw trends, support and resistance levels using lines, trend line, and horizontal line. There are two other lines available in IQ Option.

Vertical lines and Fibonacci lines. You can use vertical lines to record time within the data series. Fibonacci lines indicate an area of support or resistance.

They are a series of horizontal lines. Fibonacci lines adhere to the Fibonacci golden ratio of 1.618.

RISK WARNING: YOUR CAPITAL MIGHT BE AT RISK

Sentiment Analysis For IQ Option Strategy

IQ Option’s sentiment analysis is called Trader’s Mood.

It visually represents whether the majority of the traders are buying or selling. You can find the widget on the left side of the trading platform.

The green colored section represents the percentage of buyers of that asset and the red colored section represents the percentage of sellers.

Trader’s mood is helpful for that extra confirmation in decision-making. For a trading asset, you’ve done all your trading analysis and strictly adhered to proven trading strategies.

You have come to the conclusion that it is profitable to open a buy position on that asset.

However, you are still unsure. If you view the trader’s mood as see the majority of the traders are buying.

Knowing that you are going with the crowd will assure you and open your position with confidence.

It isn’t always accurate but helps nonetheless.

IQ Option Indicators – Technical

Best IQ Option Indicator - Binoption

There are 11 different types of technical indicators available in IQ Option.

We will list them here and give a brief explanation on each of them:

Three Killer Indicator Combinations In IQ Option Strategy

We present to you three IQ Option recommended indicator combinations.

They offer excellent technical analysis.

Make sure to utilize them when you trade.

Awesome Oscillator and Alligator:

Bill Williams developed both these indicators.

Alligator is a trend indicator. It signals a new trend, identifies its direction, and displays its strength.

You can use AO (momentum indicator)to signal entry points for opening and closing trades.

MACD and Bollinger Bands:

These two indicators go hand in hand with each other.

MACD displays the convergence and divergence of moving averages.

Bollinger bands is a trend indicator that reflects the dynamic range of price movement.

Together, MACD serves as a signal generator for entry and exit points, whereas Bollinger Bands serve as a signal filter.

 Ichimoku Cloud and RSI:

Ichimoku possesses the characteristics of trend indicator and an oscillator all at once. 

This indicator can combine with an oscillator indicator to confirm the momentum of a certain direction.

One of the oscillator indicators that combines extremely well with Ichimoku is Relative Strength Index (RSI).

RSI determines the strength of the current trend and finds the possible reversal points.

RISK WARNING: YOUR CAPITAL MIGHT BE AT RISK

Conclusion

IQ Option has a vast variety of trading tools, lines, indicators, and sentiment analysis that you combine and form the best possible strategy in your trading game.

They are also famous for their hassle free withdrawal and deposit method and their transparency.

Whatever financial instruments you trade, there is a high risk of losing money due to market volatility and uncertainty.

Keep your leverage low, diversify your asset index, make use of the trading tools and indicators, use risk management tools like stop losses and take profits.

You can follow the IQ Option strategy, tips and tricks we listed here and also the ones recommended by IQ Option and we hope it will ensure you a profit.

Top Broker

broker logo
Min Deposit
$5
Min Investment
$5
broker logo
Min Deposit
$250
Min Investment
$1
broker logo
Min Deposit
$10
Min Investment
$1
broker logo
Min Deposit
$10
Min Investment
$1
broker logo
Min Deposit
$10
Min Investment
$1

Top Robot

broker logo
Price
FREE
Min Deposit
$5
broker logo
Price
FREE
Min Deposit
$250
broker logo
Price
FREE
Min Deposit
$250
broker logo
Price
FREE
Min Deposit
$250
broker logo
Price
FREE
Min Deposit
$5

Top Signal

broker logo
Price
FREE
Delivery Type
Web
broker logo
Price
Free and Paid
Delivery Type
Telegram & Web
broker logo
Price
$97/biweekly
Delivery Type
Web
broker logo
Price
FREE
Delivery Type
Web
broker logo
Price
FREE
Delivery Type
Web

You're currently offline