Home» Binary Options Strategy » Identifying Consolidation Area: Call Put Strategy

Identifying Consolidation Area: Call Put Strategy

What Consolidation Area is?

A consolidation area is an area that has more than two support/resistance levels in the same place or almost at the same place.

A consolidation area is also part of a continuation pattern; the price movement before the consolidation area and after the consolidation area will tend to move in the same direction.

Ways of Identifying Consolidation Areas

There are few universal ways to Identifying Consolidation Areas. Lets discuss some of the ways below.

Ichimoku Kinko Hyo:

It’s one of the unique and the easiest way of Identifying Consolidation Areas.

This charting technique was developed by a Japanese journalist in the early 60s.

Ichimoku Signals or elements are considered vital in the context of overall chart.

Ichimoku Kinko Hyo is a visual technical analysis system that combines all its elements and builds a relationship, including the price.

The term loosely translates to “one look equilibrium chart”.

There are five different lines in this technique.

  1. Tenkan-sen: It’s a conversion line that is calculated by the average of an asset’s 9-period high and 9-period low.
  2. The Kinjan-sen:The Base line is calculated by the average of an asset’s 26-period high and 26-period low.
  3. The Senkou Span A: The Leading Span A is the midpoint between the conversion and baseline.
  4. The Senkou Span B: The Leading Span B is calculated by the averageof an asset’s 52-period high and 52-period low; it is also one of the boundaries of the Ichimoku Cloud and is plotted 26 periods in the future.
  5. Lagging Span :The closing price of an asset plotted 26-periods in the past.

The graph above gives an example of an Ichimoku Kinko Hyo chart. 

Pay attention to the red and green shaded areas, those are the Ichimoku Clouds mentioned above. 

When the Leading Span A is above the Leading Span B, it is a green cloud and when the Leading Span B is above the Leading Span A, it is a red cloud.

The cloud is the main tool used to analyze trends in this method; when prices are trading above the cloud, it is an uptrend and when prices are below the cloud, it is a downtrend. 

Because of this, the clouds themselves form a support or resistance level; look at the 2 examples below for indications of cloud support and resistance. 

In addition, because the boundaries of cloud are plotted in the future, when the cloud changes color it can be used as a sign of future resistance levels.

Within the larger uptrend or downward determined by whether prices are trading above or below the cloud, the relationship between the conversion line and baseline as well as the relationship between the price and the baseline can also act as smaller ‘signals’ within the larger trend. 

When the conversion line moves above the baseline within an uptrend (green cloud) or below the baseline in a downtrend (red cloud) those are examples of smaller bullish/bearish signals within an uptrend/downtrend. 

Also the price moving above or below the baseline during an uptrend/downtrend is another indicator of smaller bullish and bearish signals within their respective trends.

Consolidation Head and Shoulders

The Consolidation Head & Shoulder Pattern is a reversal pattern.

It both of the consolidation and the reversal variety.

This pattern is considered of two shoulders and a spike higher or lower that is called the head of the pattern.

There are some Head and Shoulders patterns that are consolidation patterns instead of reversal ones.

Look at both examples below:

The first chart shows the traditional reversal Head and Shoulders pattern while the second shows the consolidation Head and Shoulders pattern.

By comparing the preceding trend to the Head and Shoulders pattern with the shape of the Head and Shoulders pattern itself we can tell the difference.

In a typical reversal Head and Shoulders pattern, an uptrend will be succeeded by a Head and Shoulders Top pattern (as seen in the first chart) and a downtrend will be succeeded by a Head and Shoulder Bottom or Inverse Head and Shoulders pattern.

Use the Right Time Frame

Use of right time frame is another way of identifying consolidation area. 

The bigger the time frame, the stronger the support and resistance is. 

The opposite is true as well, as the lower the time frame, the easier for the area to be invalidated. 

If the time frame of consolidation area is a short one then the expiration dates for the traded options should be smaller as well. 

Again, if the consolidation area is to be found on the bigger time frames, like the daily, four hours’ chart or even weekly, we need to adjust the expiration date accordingly.

The best way to identify consolidation areas, by trading with moving averages and the way to go is to plot on the chart different moving averages, exponential ones or simple ones, with values from 20, 50, 100 and 200.

Elliott Waves Theory

Elliott Waves Theory means looking at patterns that happened on the left side of the chart and trying to project or to forecast the next move on the right side of the chart. 

Therefore, knowing those patterns is vital key for what to look for on the right side of the chart. 

Such patterns are most likely to be triangles as they represent the favorite way market is consolidating and triangles can be contracting and expanding. 

It is difficult to properly identify a triangular formation on the smaller time frames, but can be done on the bigger ones.

For example, complex corrections are almost always ending with a triangle so by the time the triangle is breaking its b-d trend line it means the correction is completed and most likely an impulsive move should follow. 

If the correction was bullish, then put options should be traded as the move to follow should be a bearish impulsive move, and of course if the correction was bearish, then call options should be traded as the move to follow should be a bullish impulsive move. 

Moving forward and knowing an impulsive move coming, then the most common impulsive move is the one that has the third wave being the longest so waiting for waves one and two to complete before buying an option to meet the third wave requirements should be key.

 In this case, because third waves represent fast moves, short-term expiration dates can be traded.

The theory of Elliott Wave: Mr Elliot said that in a trending market, price moves in a 5-3 wave pattern.And in this 5-3 wave pattern, there are two types of waves:

  1. the first wave pattern is called the impulse wave
  2. the second wave pattern is called the corrective wave.

Elliott wave theory allows the trader to divide the market into cycles and super-cycles and this allows for counting the waves. 

Impulsive moves are always being labeled with numbers (1-2-3-4-5) while corrective waves are always being labeled with letters (a-b-c). 

The most common corrective waves are flats, zigzags and triangles, but on complex corrections market is making combinations of those simple corrections and the result may be a double or triple flat, a double or triple zigzag, triple or double combination, etc.

So, above options can be used for identifying consolidation strategies based on patterns and based on indications. 

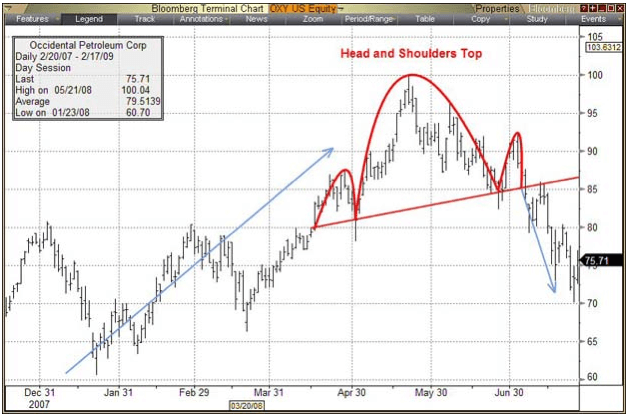
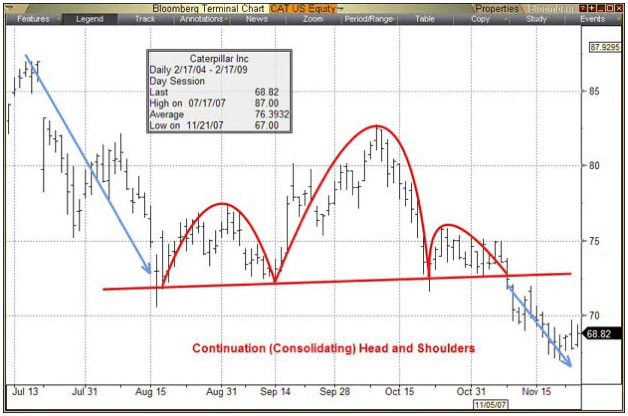
From above discussion we can come to the point that head & shoulder patterns are mosty used and the easiest way to identify the consolidation areas.

Top Broker

broker logo
Min Deposit
$5
Min Investment
$5
broker logo
Min Deposit
$250
Min Investment
$1
broker logo
Min Deposit
$10
Min Investment
$1
broker logo
Min Deposit
$10
Min Investment
$1
broker logo
Min Deposit
$10
Min Investment
$1

Top Robot

broker logo
Price
FREE
Min Deposit
$5
broker logo
Price
FREE
Min Deposit
$250
broker logo
Price
FREE
Min Deposit
$250
broker logo
Price
FREE
Min Deposit
$250
broker logo
Price
FREE
Min Deposit
$5

Top Signal

broker logo
Price
FREE
Delivery Type
Web
broker logo
Price
Free and Paid
Delivery Type
Telegram & Web
broker logo
Price
$97/biweekly
Delivery Type
Web
broker logo
Price
FREE
Delivery Type
Web
broker logo
Price
FREE
Delivery Type
Web

You're currently offline